CS 206 - Introduction to Data Structures
Assignment 7: Due 11:59PM April 2
The leaves are coming out in Pennsymvania so it is a great time to make trees of your own. You will do this virtually with a binary tree.
Part 1
Complete the implementation of LinkedBinaryTree.java with public methods as specified in BinaryTreeInterface.java
- Import LinkedBinaryTree.java and BinaryTreeInterface.java into your project from /home/gtowell/Public206/a7/
- Two methods are left for you to implement. Your implementation should be entirely recursive. No for or while loops. No ArrayLists, etc. The methods to be implemented are:
- toString The string returned should be as follows:
- One element per line in a preorder traversal of the tree.
- The element on each line should be indented two (or three) spaces times the depth of the item. (That is, a node at depth 3 should be indented 6 spaces.)
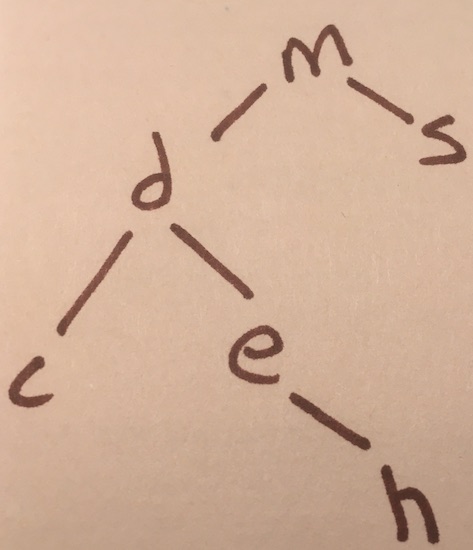
- For instance if the tree is:
 The preorder traversal of this tree -- on a single line is -- m d c e h s. Your toString function should return:
m
  d
    c
    e
      h
  s
- printNaturalOrder should return a string with all of the elements in the tree in their natural order. (Strings alphabetically, numbers ascending, etc) . For example, for the above tree, printNaturalOrder should return
c d e h m s
As with toString, this method should be entirely recursive.
Part 2
Develop a driver function for LinkedBinaryTree that illustrates the use of all of the methods in BinaryTreeInterface. If you find it convenient in the driver, you may use loops, ArrayLists or any of the items forbidden above. You driver should use integers for data items stored within the tree. That is you should create an instance of the tree with a line like:
LinkedBinaryTree<Integer> lbt = new LinkedBinaryTree<>();
Output of the driver should be self-documenting. I should not have to read the code to determine what the output shows. You should not add randomly to the tree; rather add data to the tree thet is carefully chosen to illustrate a point.
In the README file be sure to document how to use your driver. (This documentation may be as simple as saying that the driver function is in the main method of a class named Driver.)
Part 3
In this part, you will repeatedly build trees the contain Strings using the exact same LinkedBinaryTree code and in parts 1 and 2. With each tree you will record its maximum depth. Then you will generate a histogram of those maximum depths. To aid you in this endeavor, import DataProviderS.java and Histogrammer.java from /home/gtowell/Public206/a7/.
- Read over the code in DataProviderS.java. In particular, look at the main method for illustrations on the use of this class.
- For each tree get 20000 strings (using the nextString() method) from DataProviderS initialized to create 3 character long strings and to suggest removal one time in every 25. After 20000 draws you will have duplications. Per the definition in BinaryTreeInterface, you should ignore duplicates. Each time you get a string from DataProviderS, before adding that string to the tree, call the method removeP(). If this method returns true, then rather than adding the string to the tree, remove it (if it is in the tree). Between duplications and removals your trees will typically contain on the order of 15000 nodes. Here is pseudocode (ish) for the tree-filling algorithm:
let lbt = new LinkedBinaryTree<String>();
let dps = new DataProviderS(11, 3, 25);
repeat 20000 times
    let s = dps.nextString()
    if dps.removeP():
        insert s into lbt
    else
        remove s from lbt
For example, suppose DataProviderS is initialized to generate single character strings and gives strings in the order [m s w d s] and gives values for removeP in the order [F F F F T] then the final tree would be:

- Build 1000 trees using the above algorithm. Be careful with the initialization of DataProviderS. The first parameter must be different for each of the 1000 runs. From each of the 1000 trees collect its height. Store the height in an array of ints where each item in the array holds the count of the number of times a tree of that depth has been created. For instance, suppose that after creating 10 trees you had seen depths of [5, 4, 6, 3, 4, 3, 4, 3, 2, 5], then the data collection array would be
		POSITION   0 1 2 3 4 5 6 7 8 9
		VALUE      0 0 1 3 3 2 1 0 0 0
Actual heights will likely be in the range 1..100.
- Pass the collected array of ints to Histogrammer.java to create a simple histogram of your data. Save this histogram to hand in with the rest of your assignment. The easiest way to save the histogram is to use the function in Histogrammer that writes a histogram directly to a file. (See the main method in Histogrammer for examples.)
- In README, write an brief analysis of your histogram. Focus particularly on the depth of the trees. Are the depths you recorded in the range you expect? What is the theoretical upper and lower bounds of the range? What is the effect on depth of the occasional deletions? (Is there any effect?) Other topics might also be relevant. Suprise me for a extra credit.
Electronic Submissions
Your program will be graded based on how it runs on the
department’s Linux server, not how it runs on your computer.
The submission should include the following items:
- README: This file should follow the format of this sample README (https://cs.brynmawr.edu/cs206/README.txt) Be sure to include in the README the analysis and descriptions as described above.
- Source files: Every .java file used in the final version of every part of your project (including the imported files)
- Unique Data files used: This includes the maze file of your own design
- A file containing your histogram, from part 3 (if needed)
DO NOT INCLUDE: Data files that are read from the class site.
The following steps for submission assume that you created a project named AssignmentN in the directory /home/YOU/cs206/
- For this assignment N=7
- Put the README file into the project directory and your maze (/home/YOU/cs206/AssignmentN)
- Go to the directory /home/YOU/cs206
- Enter submit -c 206 -p N -d AssignmentN
For more on using the submit script click here
|